Introducing a new tool to convert and combine Kraken reports!
Quick links
- Repository: https://github.com/jeanmanguy/spideog
- README: https://github.com/jeanmanguy/spideog/blob/main/README.md
- Binaries: https://github.com/jeanmanguy/spideog/releases
Earlier this year I started working on a metagenomic project and I also started to learn Rust. To classify and assign sequencing reads to taxons I use Kraken 21 combined with Bracken2.
Goals
I have some problems with the Kraken reports format. I can't easily make plots with R with them. For example I wanted to use the taxonomy data to draw trees with ggtree3, you can't do that easily: the taxonomic tree is encoded using indentation mixed with the abundance data. The format used by Metaphlan4 is slightly better but has the same problems.
So, as I was learning Rust I set up myself with the goal of making a simple command line software in Rust to parse Kraken reports and to transform them into standard and tidy text formats.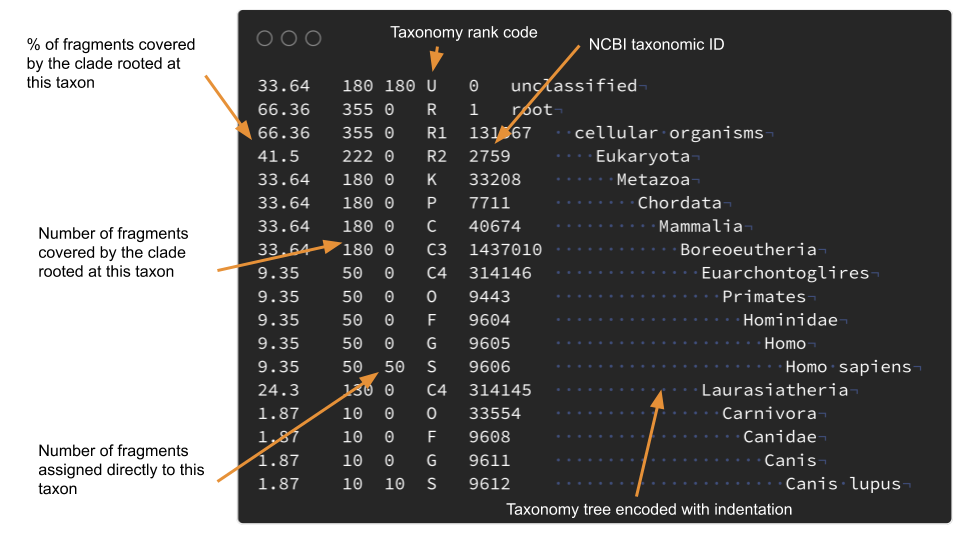
One of my goals was to combine data from multiple reports in order to ease the analysis of multiple samples. It was also important for me to not waste time working on deployment and installation procedures. At the same I was working on setting up a Nextflow pipeline to launch jobs on the university's HPC cluster "SONIC".
Implementation
I developed Spideog to read one or multiple Kraken report and write one tree file or one CSV file. I use the simple Newick format for the tree, and a tidy format5 for the abundance data. Newick trees are easily readable in R (and other analysis language) with the {ape} package6, and tidy data is the standard for the Tidyverse7, the easiest way to format data if you make plots with {ggplot}8. These file formats can be combined to merge the results of multiple analysis.
Spideog is implemented in Rust. I set up a continuous integration to build binaries for Linux, OSX, and Windows. No dependencies needed. No Docker container or Conda environment needed. No need to have Rust installed on the machine. I added the binary to my Nextflow pipeline (in the bin/ folder, you could make a container wrapper if you want to have everything in containers and not have binaries in your git repository), it works like a charm on the cluster, no extra hassle.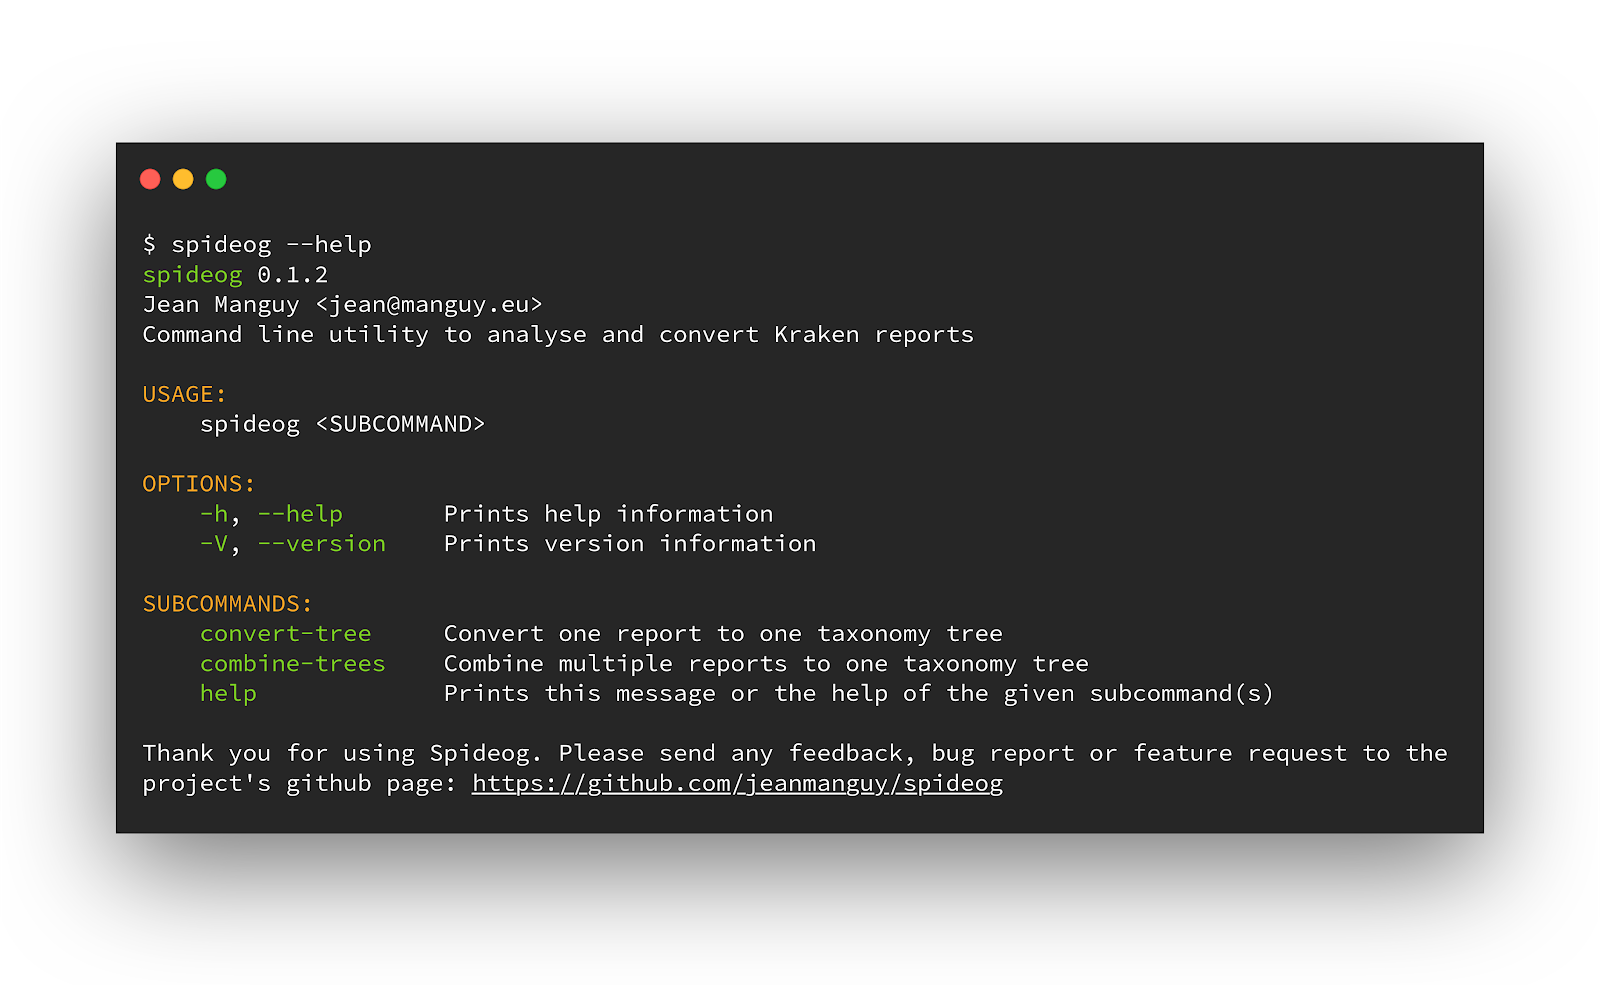
Example
For development and test purposes I manually crafted 2 kKraken reports with few differences in read counts and also with different species found.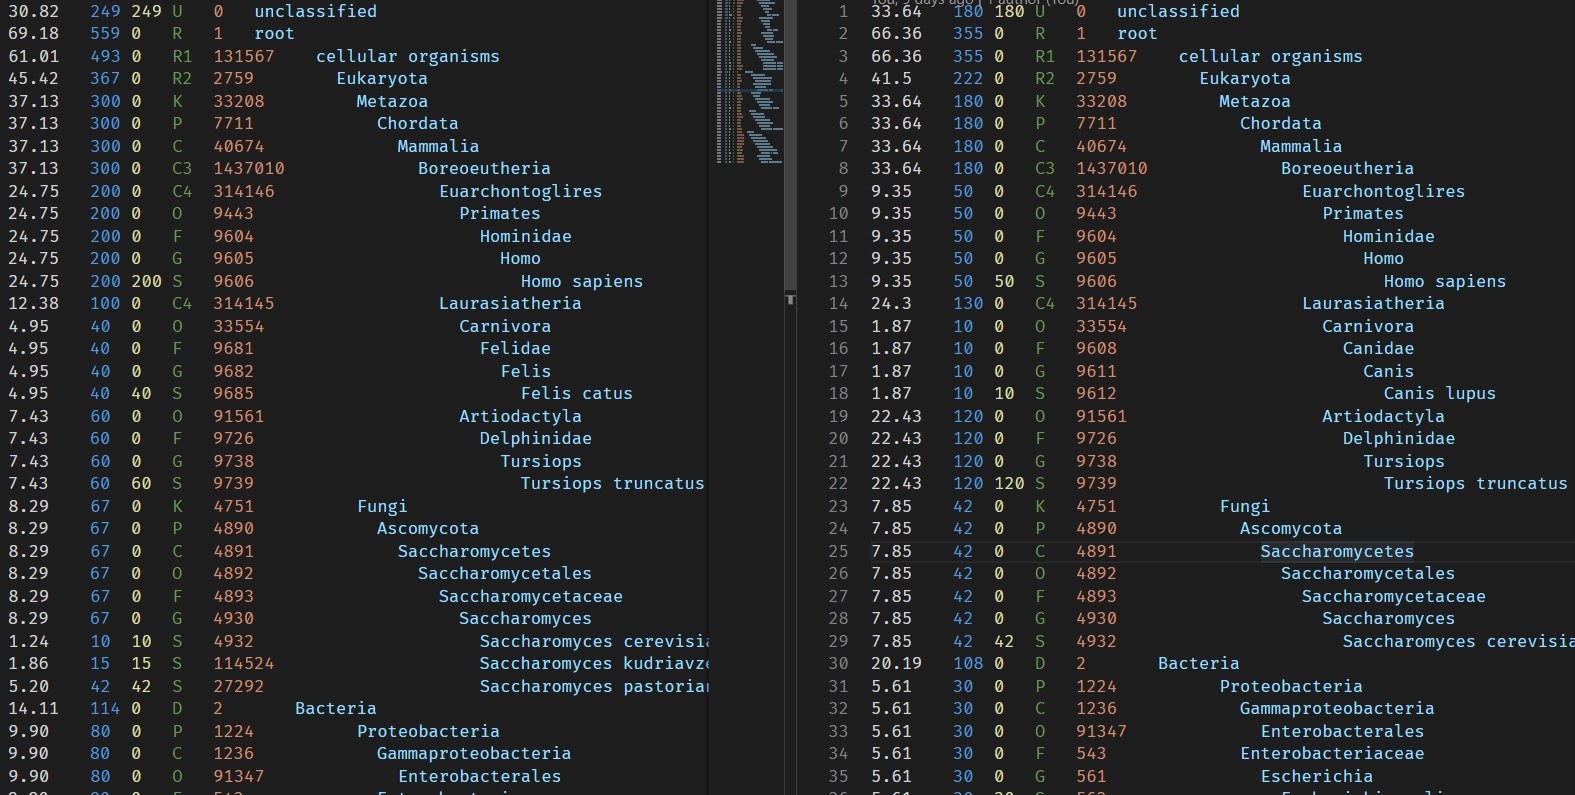
The Spideog's subcommand combine-trees will take all the reports you give it (thanks for glob) and generate a single tree in Newick format, that you can read with ape and ggtree. The subcommand combine-abundances will produce 1 CSV file that can be read with R. Then using fortify on the tree object to get a data frame, you can join the 2 objects to plot heatmap and other data visualisation with ggplot2 (or base R plot functions).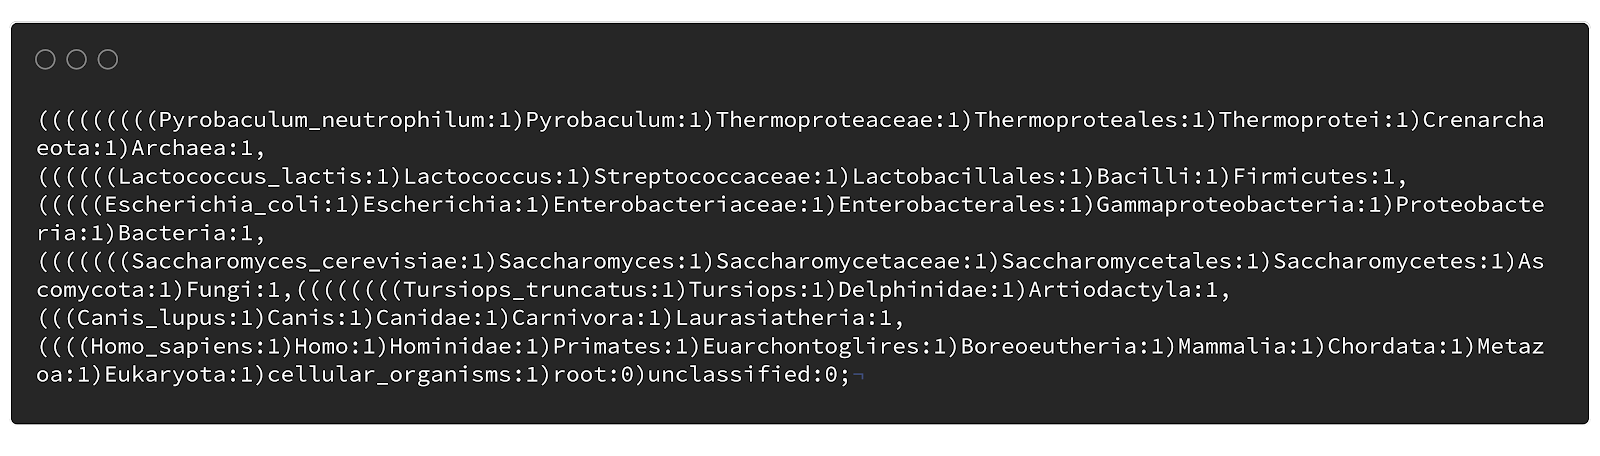
Conclusions
Spideog is my first command line application in Rust. Would I do it again? Yes, defetitively. This was a great experience for me. This project had the right scope, enough to do to learn a lot and have to write quite a lot of Rust (not everything was pre-baked in existing libraries). Transforming text files from weird formats to standard / useable formats is something I am quite used to now so it was also a good subject, and an useful one I hope. There was not a lot of stakes in this project. If I struggled with Rust I could easily abandon it and hack together a version in R for my specific plots for my day job and not release anything publicly.
Productivity was helped by the absence of configuration and environment work that plagues bioinformatics software. Possdible users could just download binaries and try spideog and don't have to look for existing Conda recipes or Docker containers.
I didn't run any benchmark or try to optimize for speed. The only speed optimization over some Python or R script I could have hastily crafted was to use Rust, a compiled programming language. I am sure there are plenty of things to improve in my code. But it works well, works already well enough to be added to an analysis workflow and be ran on an HPC cluster without worry about the installation. Future work on it will not have to suffer any overhead regarding containers or environment, it is a bit boring but it works.
It felt like I could focus only on the bioinformatics and forget a bit all the chores and housekeeping that is always involved with Python and R development. I am still learning so there was still some. But once I had a good idea how to manage errors with the crate ThisError and Eyre, and how to manage command line arguments with Clap, I felt that things were falling in place.
Internally I manage the taxonomy in an actual network / tree structured using the crate Daggy (which is built on top of petgraph). I feel like a lot more needs to be done in Rust to handle phylogenetic trees. For a taxonomy tree and the simple tasks I perform in Spideog, it was enough, but R' {ape} and {phytools} (and their Python's counterparts) still have bright days ahead.
Thanks
I would like to thank the Rust developpers, maintainers and documenters for their great work, and the Rust community members for their help on Discord when I was not so sure about the language.
References
Wood, D. E., Lu, J. and Langmead, B. (2019) ‘Improved metagenomic analysis with Kraken 2’, Genome Biology, 20(1), p. 257. doi: 10.1186/s13059-019-1891-0.
Lu, J. et al. (2017) ‘Bracken: estimating species abundance in metagenomics data’, PeerJ Computer Science, 3, p. e104. doi: 10.7717/peerj-cs.104.
Yu, G. et al. (2017) ‘ggtree: an r package for visualization and annotation of phylogenetic trees with their covariates and other associated data’, Methods in Ecology and Evolution, 8(1), pp. 28–36. doi: 10.1111/2041-210X.12628.
Beghini, F. et al. (2020) ‘Integrating taxonomic, functional, and strain-level profiling of diverse microbial communities with bioBakery 3’, bioRxiv, p. 2020.11.19.388223. doi: 10.1101/2020.11.19.388223.
Wickham, H. (2014) ‘Tidy Data’, Journal of Statistical Software, 59(1), pp. 1–23. doi: 10.18637/jss.v059.i10.
Wickham, H. et al. (2019) ‘Welcome to the Tidyverse’, Journal of Open Source Software, 4(43), p. 1686. doi: 10.21105/joss.01686.
Paradis, E. and Schliep, K. P. (2019) ‘ape 5.0: an environment for modern phylogenetics and evolutionary analyses in R’, Bioinformatics, 35(3), pp. 526–528. doi: 10.1093/bioinformatics/bty633.
Wickham, H. (2009) ggplot2: Elegant Graphics for Data Analysis. New York: Springer-Verlag (Use R!). Available at: //www.springer.com/gp/book/9780387981413 (Accessed: 10 May 2018).